Why full signal bars don’t always mean a great mobile experience—and which RF metrics actually matter.
We’ve all experienced it.
You look at your phone and see four or five bars of signal, yet your video won’t load, your Teams call drops, or a web page refuses to open.
How is that possible?
The answer is simple: signal strength is only one part of the mobile experience.
While metrics like RSRP and RSSI are useful indicators of radio coverage, they don’t tell you whether users can actually make calls, browse the web, or use business-critical applications.
For organisations responsible for managing wireless networks, understanding the difference between signal strength and user experience is becoming increasingly important.
Why Signal Bars Can Be Misleading
Most smartphones simplify complex radio measurements into a familiar signal bar icon.
Those bars generally represent how strong the radio signal is between your device and the network.
But they don’t measure:
- Network congestion
- Latency
- Packet loss
- DNS failures
- Carrier performance
- Data throughput
- Signal quality
This explains why users can experience poor connectivity despite appearing to have excellent reception.
A strong signal simply means your device can hear the network.
It doesn’t guarantee the network can deliver a good user experience.
Why RSRP Isn’t Enough
One of the most common RF measurements is Reference Signal Received Power (RSRP).
RSRP measures the strength of the LTE or 5G reference signal reaching the device.
It’s an important metric because it indicates whether adequate coverage exists.
However, RSRP answers only one question:
“How strong is the signal?”
It doesn’t answer:
- Can I browse the internet?
- Will my voice call remain stable?
- Is the network congested?
- Is the carrier experiencing issues?
- Are applications responding quickly?
Two locations can have identical RSRP values while delivering completely different user experiences.
That’s why relying on signal strength alone often leads to incorrect conclusions.
Signal Strength vs Signal Quality
A stronger signal isn’t always a better signal.
Imagine trying to have a conversation in a crowded room.
The person speaking may be loud enough to hear—but if everyone else is talking too, understanding them becomes difficult.
Wireless networks behave similarly.
Signal strength measures how loud the signal is.
Signal quality measures how clearly it can be understood.
This is where metrics like SINR become critical.
SINR vs RSSI: What’s the Difference?
Several RF metrics work together to describe network performance.
RSSI (Received Signal Strength Indicator)
RSSI measures the total received radio energy, including:
- Desired signal
- Interference
- Background noise
A high RSSI value doesn’t necessarily indicate a good connection because interference is included in the measurement.
SINR (Signal-to-Interference-plus-Noise Ratio)
SINR measures how clean the signal is relative to interference and background noise.
This is often one of the best indicators of actual user experience.
Poor SINR typically results in:
- Slow downloads
- Buffering
- Dropped calls
- Failed uploads
- Poor voice quality
A location with moderate signal strength but excellent SINR often performs better than one with very strong signal strength but heavy interference.
Throughput Is What Users Actually Experience
Users don’t care about RSRP or SINR.
They care about whether their applications work.
That’s why throughput is one of the most important performance indicators.
Throughput measures how much data can actually be transferred across the network.
It reflects the real-world performance users experience when:
- Streaming video
- Joining Teams or Zoom meetings
- Accessing cloud applications
- Browsing websites
- Downloading files
Good signal strength with poor throughput usually indicates another underlying issue, such as congestion, interference, or carrier performance problems.
Latency Matters More Than Many People Realise
Speed isn’t everything.
Latency—the time it takes for data to travel across the network—is equally important.
High latency affects:
- Voice calls
- Video conferencing
- Online collaboration
- Remote desktop sessions
- Cloud applications
Even if download speeds appear acceptable, excessive latency can make applications feel slow or unreliable.
For mission-critical environments such as hospitals, airports, stadiums, and manufacturing facilities, latency is often just as important as throughput.
Don’t Forget DNS Performance
One of the most overlooked causes of poor mobile experience is DNS.
Every time a user opens a website or cloud application, their device performs a DNS lookup before any content is downloaded.
If DNS requests are slow or failing:
- Applications appear unresponsive.
- Websites refuse to load.
- Users assume the wireless network is broken.
In reality, signal strength may be excellent.
Without monitoring DNS performance, these issues are easily missed.
Why Users Still Complain Despite “Good Coverage”
This is one of the biggest frustrations for IT and operations teams.
Traditional monitoring systems often report:
DAS healthy
Equipment online
Strong signal levels
Yet users continue reporting:
- Dropped calls
- Poor voice quality
- Slow internet
- Failed applications
- Intermittent connectivity
The reason is simple.
Traditional monitoring focuses on infrastructure.
Users experience the network.
Those aren’t always the same thing.
A healthy network doesn’t automatically deliver a healthy user experience.
Measuring the Complete Mobile Experience
To truly understand RF performance, organisations need to monitor more than just signal strength.
A complete picture includes:
- RSRP
- SINR
- RSSI
- RSRQ
- Throughput
- Latency
- DNS success
- Carrier availability
- Network transitions
- Historical performance trends
Together, these metrics reveal what users are actually experiencing—not just what the infrastructure reports.
How AirScan Goes Beyond Signal Strength
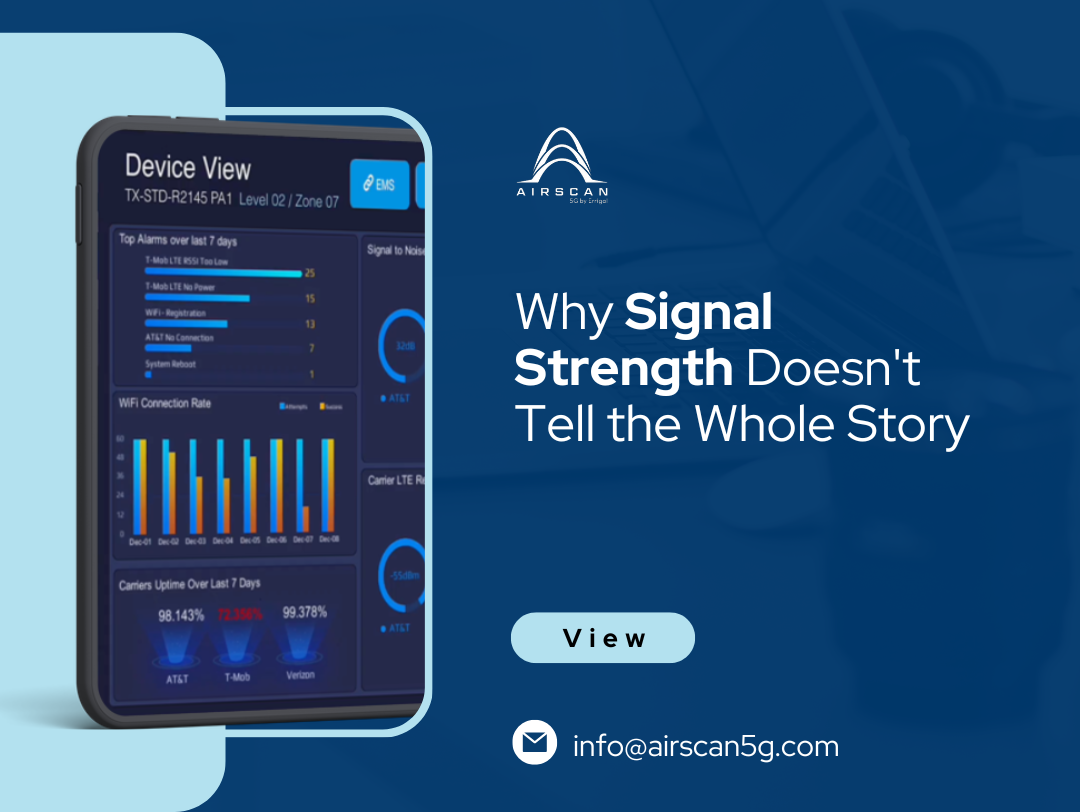
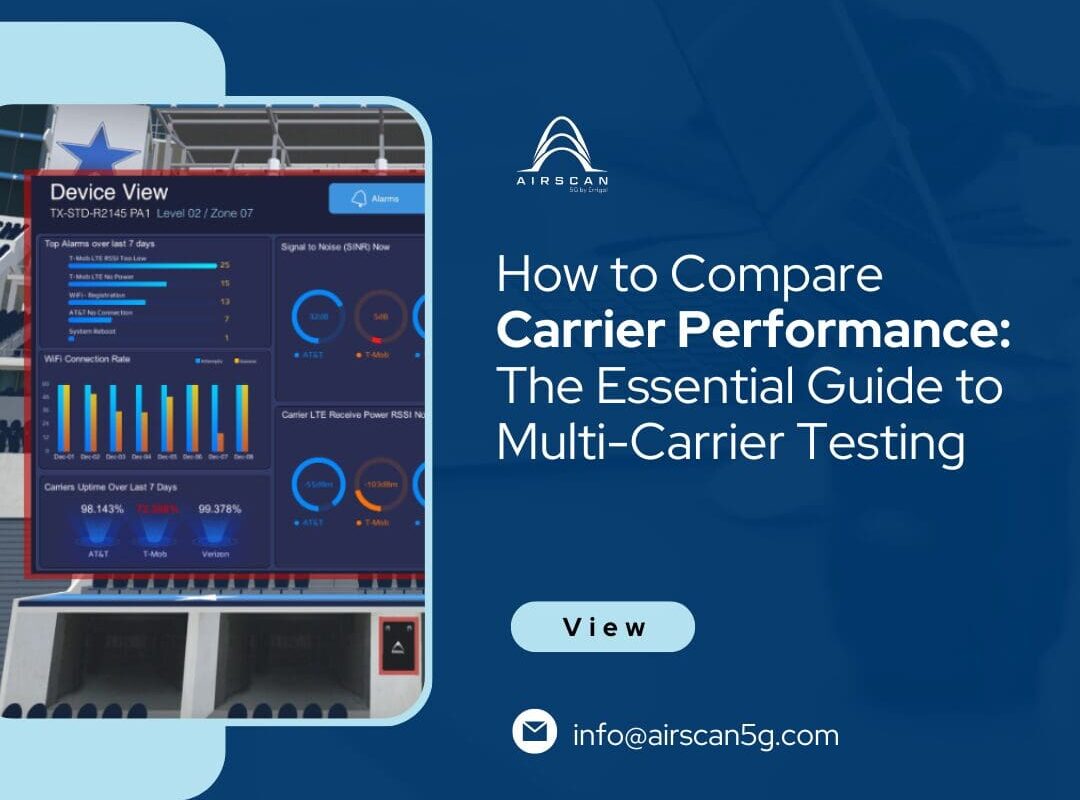
AirScan is designed to measure the network from the user’s perspective rather than relying solely on infrastructure metrics. By continuously testing across multiple mobile carriers and WiFi networks, it monitors real-world KPIs including RSRP, RSRQ, RSSI, SINR, throughput, latency, DNS resolution, and PCI transitions. This enables operations teams to detect service degradation, carrier-specific issues, and hidden performance problems before users begin reporting them.
Final Thoughts
Strong signal bars can create a false sense of confidence.
While signal strength remains an important measurement, it’s only one piece of the RF performance puzzle.
To deliver reliable mobile connectivity, organisations need visibility into the complete user experience—from signal quality and throughput to latency, DNS performance, and carrier reliability.
The most successful wireless operations teams don’t simply ask:
“Is there coverage?”
They ask:
“Can users actually use the network?”
That’s the difference between monitoring signal strength and understanding real-world RF performance.